Executive Summary:
Value and Growth are not just two styles but two different philosophies with different sensitivities to macroeconomic environments. Historical data shows a long-term value premium, yet low-rate, liquidity-driven regimes have favored growth. The key is not choosing one side forever, but improving measurement precision and adjusting weights by environment. This report highlights the limitations of the old dichotomy and introduces Value 2.0, Growth 2.0, Multi-Factor strategies, and Spread-Gating models as smarter ways forward.
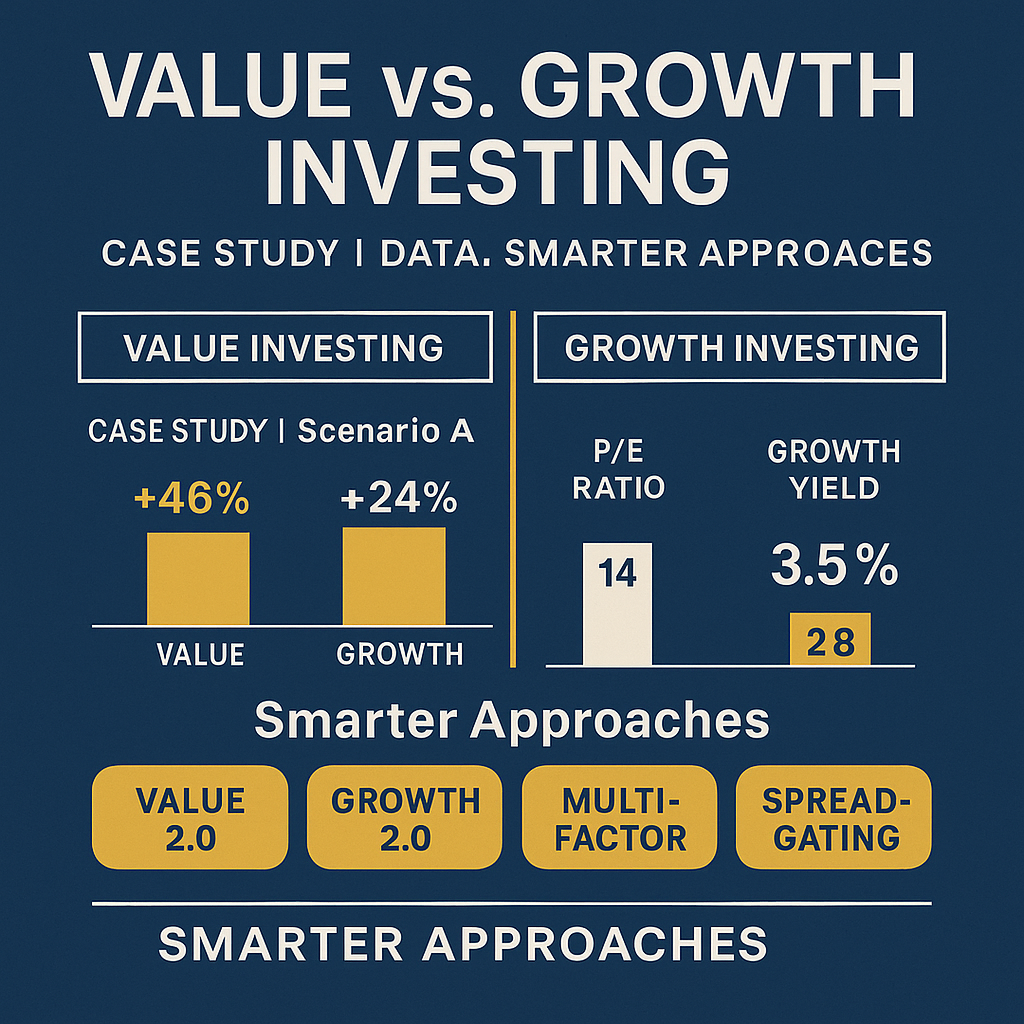
1) Why the “Value vs. Growth” Divide is Incomplete
- Measurement Issues: Defining value by P/B alone misses companies rich in intangibles (brand, R&D). Growth defined by revenue expansion alone ignores poor unit economics.
- Accounting & Industry Shifts: In the digital era, intangibles are expensed, not capitalized, distorting reported earnings.
- Macro Sensitivity: Discount rates (interest rates) act as a lever on growth valuations. A 1% change in rates impacts growth stocks far more than value stocks.
- Implementation Costs: Real-world style ETFs suffer from tracking error, sector concentration, and turnover costs, creating gaps with backtested returns.
2) Scenario Analysis – The Sensitivity to Rates & Growth
Scenario A | Rate Hikes & Normalization
- Value: P/E 12→14, Dividend Yield 3.5%, Earnings Growth 5%
- Growth: P/E 35→28, Dividend Yield 0.8%, Earnings Growth 15%
3-Year Returns:
- Value ≈ +45.6% (CAGR +13.3%) → $100 → $145.56
- Growth ≈ +24.1% (CAGR +7.5%) → $100 → $124.07
Scenario B | Ultra-Low Rates & Risk-On
- Value: P/E 12→10, Dividend 3.5%, Earnings Growth 4%
- Growth: P/E 35→40, Dividend 0.8%, Earnings Growth 18%
3-Year Returns:
- Value ≈ +4.2% → $100 → $104.24
- Growth ≈ +90.2% → $100 → $190.18
Conclusion: Value vs. Growth is a function of discount rates × growth expectations. A static bet is dangerous; a dynamic framework is smarter.
3) Better Method ① — Value 2.0 (Intangibles & Cash Flow)
- Upgrade metrics: Use EV/EBITDA, Free Cash Flow Yield, normalized earnings, and intangible-adjusted P/B.
- Avoid value traps: Screen with ROIC, reinvestment ratio, leverage.
- Sector-neutral analysis: Pick relative value within sectors to avoid overweighting banks or energy.
4) Better Method ② — Growth 2.0 (Quality of Growth)
- Unit Economics: LTV/CAC, cohort retention, Rule of 40 (for SaaS).
- Cash Conversion: Revenue → operating profit → FCF conversion rate.
- Anchoring to earnings: Even growth stocks need profit-based multiples (EV/EBIT, FCF) to prevent bubble chasing.
5) Better Method ③ — Multi-Factor Integration (Value × Quality × Momentum)
- Why: Each factor’s weaknesses are offset by others. Value is slow, momentum chases, quality can get expensive.
- Sample Allocation:
- Core: 60% broad equity/bond index
- Factors: 40% split into Value 15% + Quality 15% + Momentum 10%
- Rules: Quarterly rebalance (±20% bands), cap turnover, sector-neutral, position cap ≤ 5%.
6) Better Method ④ — Spread-Gating (Valuation Spread Regime)
- Definition: Adjust tilts only when valuation spreads between Value vs. Growth (EV/EBITDA z-score) diverge significantly.
- Rule Example:
- Z ≥ +1.5 → Overweight Value by +10%
- Z ≤ -1.5 → Overweight Growth by +10%
- Neutral zone (±1) → Stick to Core
- Advantage: Turns “cheap vs expensive” into a systematic timing rule.
7) Portfolio Playbook for Individual Investors
- Define risk targets: Tracking Error 4–6%, Max Drawdown tolerance.
- Build with Core (broad index ETFs) + Factors.
- Allocate: Core 60–70% / Factors 30–40% (adjusted via spread-gating).
- Rebalance annually or via ±20% bands.
- Compare by after-tax, all-in costs (fees + spreads + turnover).
- Risk controls: sector neutrality, ≤5% per stock, ≤15% in thematic total, cash buffer.
8) The Data Hygiene Problem in Backtests
- Survivorship bias, look-ahead bias, and unaccounted trading costs distort results.
- Cross-validation across regions and time periods is necessary.
- Crowding risk: Popular factors may lose alpha as flows dilute them.
9) Journalist’s Take — “Keep the Philosophy, Modernize the Rules”
Value and Growth philosophies remain valid. But Value 2.0 & Growth 2.0 frameworks plus multi-factor integration and spread-gating make portfolios more robust.
Instead of betting on one side, rule-based tilting aligned with macro context raises survival odds.
30-Second Summary
- Value vs. Growth is not binary; it is environment-dependent.
- Better methods: Value 2.0 (intangibles, cash flow), Growth 2.0 (unit economics), Multi-Factor combos, Spread-Gating rules.
- Implementation: Core index + rule-based tilts, always compare after-tax, all-in returns.
Disclaimer: This report is educational. Investors should consider personal financial circumstances and seek professional advice if needed.