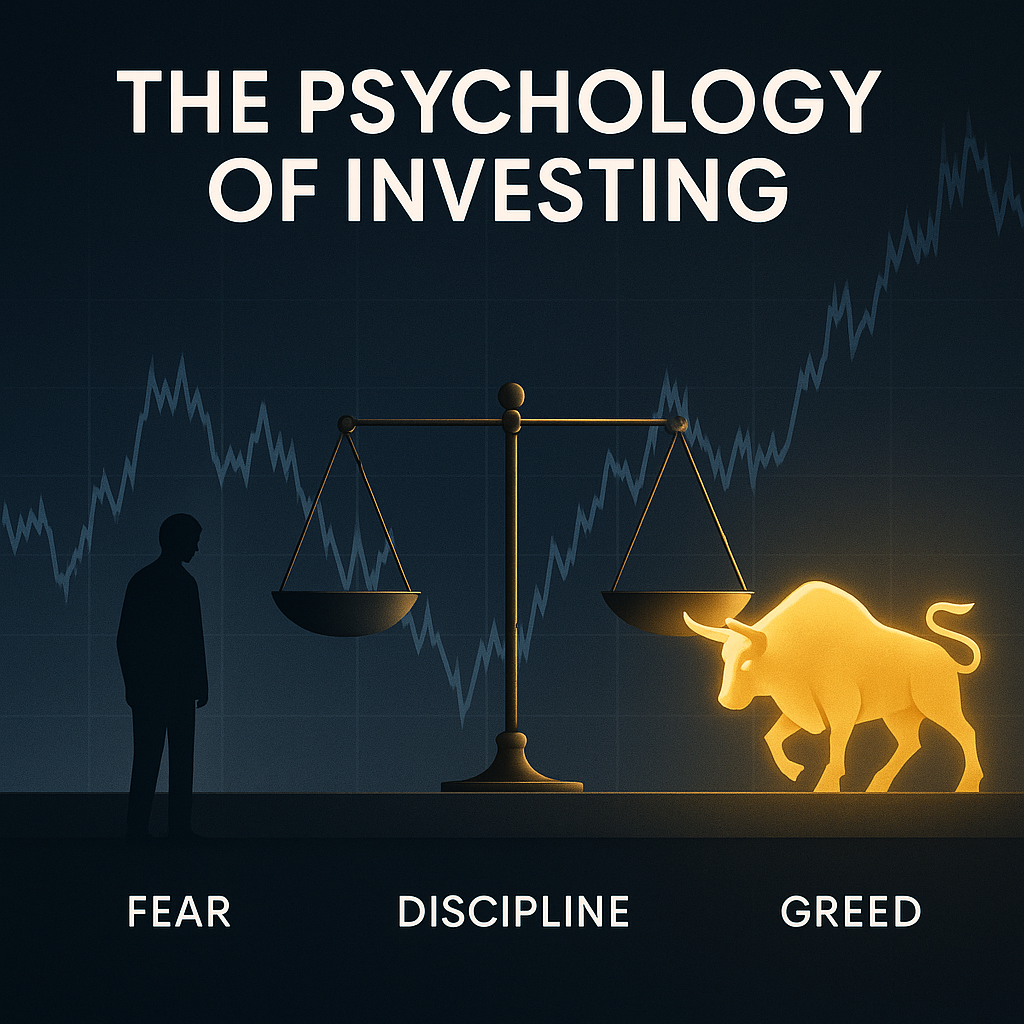
One-Line Definition: Market returns are not only a battle of information but, more fundamentally, a battle of self-control. Greed manifests as overconfidence, while fear leads to premature capitulation. The solution is not to suppress emotions, but to channel them through structure.
1) How Psychology Eats Away at Returns
- Loss Aversion: The pain of losses is about 2x stronger than the pleasure of gains → Investors often hold onto losses too long and sell winners too quickly (disposition effect).
- Overconfidence: Overestimating one’s ability to predict timing → Leads to concentration and leverage risks.
- Herding and FOMO: Exposure to stories of others making money drives chasing rallies.
- Recency Bias: Mistaking recent performance for a permanent trend → Optimism at peaks, pessimism at troughs.
- Anchoring: Obsession with old purchase prices or targets → Failure to adapt to new environments.
Mathematical Warning: After a -50% loss, it takes a +100% gain to break even. Avoiding deep drawdowns matters more than chasing high returns.
2) Market Phases: “Greed & Fear” Signals and Responses
Late Bull Market (Greed Dominant)
- Signals: Surge in new accounts, overheated IPOs, narratives drive prices more than earnings.
- Response: Use rebalancing for profit-taking and risk trimming (±20% band from target allocation). Gradually increase cash and bonds, review thematic exposure.
Early Crash (Fear Spiking)
- Signals: Volatility surges, margin call headlines, heavy sell-offs with massive volume.
- Response: Stick to a pre-set risk budget (e.g., max equity 60%, buy in 10% increments). Avoid panic market sells; instead follow predefined, staged rules.
Bottom Formation (Cynicism / Apathy)
- Signals: Prices hold despite bad news, volume dries up, only long-term investors remain.
- Response: Maintain systematic DCA ($1,000/month) into core assets (broad ETFs, Treasuries). Recheck valuation spreads and base rates.
Sideways / Uncertain Markets
- Signals: Rotating themes, no clear trend.
- Response: Prioritize income (dividends, bond coupons), reduce excessive trading, focus on minimizing taxes & fees.
3) Taming Emotion Through Design: The M.A.P.S. Framework
M | Mindset
- Judge yourself not only on absolute returns but also on rule adherence rate (≥ 80%).
- Define maximum drawdown tolerance: “At -20% equity drawdown, what will I do?”
A | Architecture
- IPS (Investment Policy Statement): Return/volatility goals, asset classes, rebalancing rules, position limits (e.g., 5% per stock), buy/sell triggers.
- Risk Budgeting: Set VaR/drawdown limits per asset class; ban margin/leverage.
- Friction Design: Delay impulsive trades (24-hour cooling-off period, only automatic DCA allowed).
P | Process
- Rebalancing: Semi-annual or band-based (±20% from target allocation).
- Checklists: Mandatory 6 questions before trades.
- Journaling: Pre/post-trade 2-line notes (hypothesis, base rate, risk). Review after 90 days.
S | Safety
- Cash Emergency Fund: 3–6 months living expenses + short-term Treasuries.
- High-Risk Exposure Cap: Thematic/emerging/private < 15% total.
- Risk Override: If portfolio loss exceeds X%, suspend new buys and rebuild cash allocation.
4) Nine Behavioral Biases and Countermeasures
- Disposition Effect: Cutting gains early, holding losses.
- Fix: Mechanical rebalancing to force trimming winners & cutting losers.
- Confirmation Bias: Seeking only supportive info.
- Fix: Write down 3 disconfirming arguments before trade.
- Overconfidence / Overtrading
- Fix: Quarterly turnover cap (≤ 25% portfolio). Exceed = mandatory 1-quarter pause.
- Anchoring
- Fix: Update valuations, spreads, and fundamentals, not past prices.
- Recency Bias
- Fix: Pin long-term return/volatility tables (30 years) at desk.
- Herding / FOMO
- Fix: Limit exposure to hype media. New ideas → 2-week watchlist before execution.
- Loss Aversion
- Fix: Size positions by risk units (5% max per stock, volatility-adjusted).
- Identity Bias (I like this company)
- Fix: Compare with ETF alternative covering same theme.
- Mental Accounting
- Fix: Express everything as % of total USD portfolio.
5) Execution Tools: Practical Checklist
6 Pre-Trade Questions
- Can I state the investment thesis in 2 sentences?
- Have I checked the base rate (long-term average returns/risks)?
- What are 3 counterarguments?
- What is my max loss scenario and response?
- Is position size set by risk, not emotion?
- Does this align with my IPS & rebalancing rules?
Monthly Routine: Review allocation vs. targets, turnover %, fees, taxes, journal entries.
Quarterly Routine: Update risk scenarios (rates, FX, policy). Recheck “why hold/buy?”
6) Case Studies – When Structure Beats Emotion
- 2008 & 2020 crashes: Band rebalancing forced buying at panic lows, fueling recovery.
- Hype booms: Allocation caps prevented overexposure at peaks.
- Stock failures: Journaling enabled post-mortem analysis, avoiding repeat mistakes.
7) Guidelines by Investor Level
- Beginner: 2–3 broad ETFs, simple DCA ($500/month), 1-page IPS, annual rebalance.
- Intermediate: Small factor/sector tilts, risk budgets, journaling, band rebalancing.
- Advanced: Tax optimization, direct indexing, risk parity, measure performance by rule adherence.
30-Second Summary
- Greed and fear amplify decision volatility, not just price volatility.
- The solution: structure > emotion (IPS, rebalancing, risk budgets, checklists, journaling).
- Avoiding deep losses is the best alpha. Automate rules, document decisions.
- Long-term results = intelligence × emotional control × system design.
Disclaimer: This article is for educational purposes only. Investment decisions are the responsibility of the reader. Consult financial/tax advisors if needed.
